




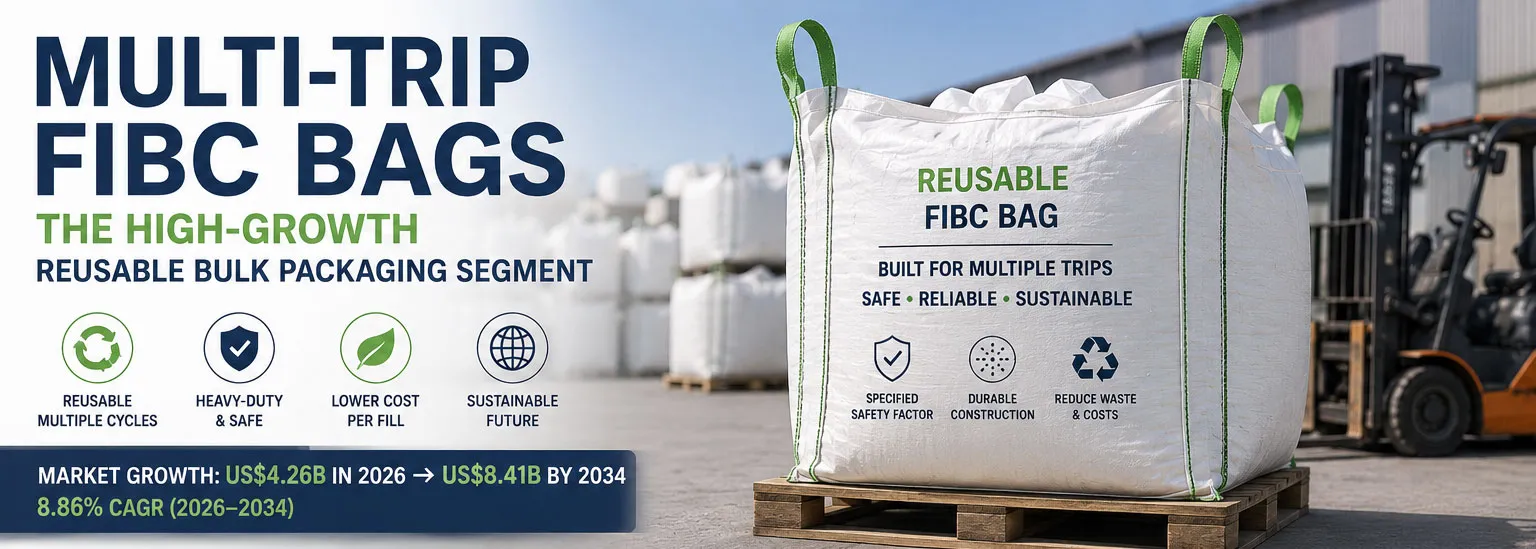
According to Packaging Market Insights, the multi-trip FIBC bags segment is projected to grow faster than the overall FIBC market, from US$4.26 billion in 2026 to US$8.41 billion by 2034 at an 8.86% CAGR. The segment is attracting industrial buyers because reusable bags can shift the purchasing decision from price per bag to cost per successful fill when a managed return, inspection and cleaning system is available. This guide explains the market outlook, total-cost logic, safety and construction requirements, applications and supplier-selection criteria for multi-trip FIBC bags.
Multi-trip FIBC bags are reusable bulk containers built for multiple validated filling, handling and emptying cycles. They make commercial sense when a managed return, inspection and cleaning loop exists, because the higher purchase price is amortised across successful cycles. Buyers should compare cost per successful fill using actual return, inspection, cleaning, loss and replacement rates — not simply the unit price.
Market Size and Growth
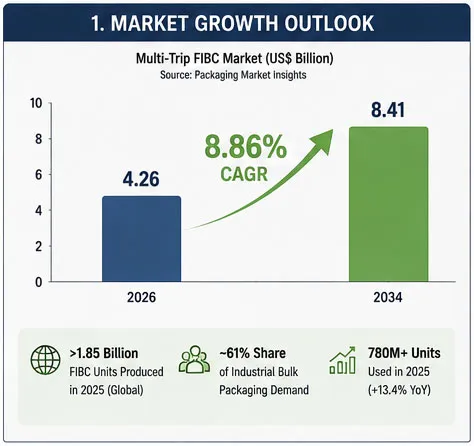
Packaging Market Insights projects the multi-trip FIBC bags segment to expand from US$4.26 billion in 2026 to US$8.41 billion by 2034. The forecast implies that reusable FIBC is becoming a more important segment of industrial bulk packaging, although buyers should review the source’s market definitions and methodology before using the figures for procurement or investment planning.
| Metric | Value |
|---|---|
| Multi-trip FIBC market 2026 | US$4.26 billion |
| Projected 2034 | US$8.41 billion |
| CAGR 2026-2034 | 8.86% |
| 2025 global FIBC production | >1.85 billion units |
| Multi-trip share of industrial bulk demand | ~61% |
| 2025 multi-trip usage | 780 million+ units (+13.4% YoY) |
| Chemical-sector adoption | 42% (2022) → 58% (2025) |
The chemical sector is particularly relevant to the multi-trip model because repeatable industrial flows can make return, inspection and cleaning systems easier to manage. The cited adoption trend therefore supports the broader total-cost argument, but the reported percentage should be interpreted according to the source’s defined measurement basis.
Single-Trip vs Multi-Trip: The Total-Cost View
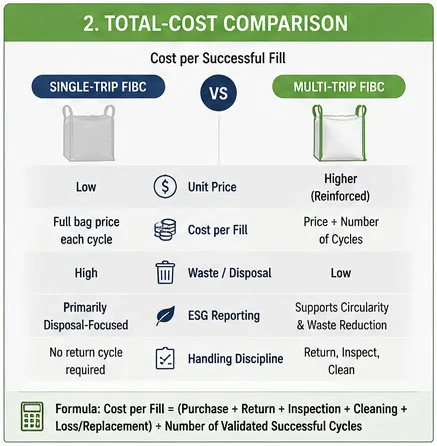
The decisive comparison is cost per use, not cost per bag:
| Factor | Single-trip | Multi-trip |
|---|---|---|
| Unit price | Low | Higher (reinforced) |
| Cost per fill | Full bag price each cycle | Price ÷ number of cycles |
| Waste / disposal | High | Low |
| ESG reporting | Primarily disposal-focused | Reuse can support documented circularity or waste-reduction metrics when actual reuse cycles are measured |
| Handling discipline | No return cycle required | Return, inspect, clean |
Key Takeaway: The cited forecast indicates faster projected growth for multi-trip FIBC bags than the overall FIBC category, but buyers should validate the underlying market definitions before using the figures for planning. Also note that ocean FCL freight is constrained by both container volume and payload weight, so bag construction should be optimised against the packed product and container plan.
Note that GSM measures fabric mass while tensile/burst are performance measurements; construction should be selected against the SKU’s required load, handling and reuse conditions rather than assuming a heavier bag is simply a reinforced single-trip bag.
If a reusable bag completes multiple validated cycles, its purchase price can be amortised across those cycles; buyers should calculate cost per successful fill using actual return, inspection, cleaning, loss and replacement rates.
Basic cost-per-fill logic: estimated cost per successful fill = purchase cost + return, inspection and cleaning costs + expected loss or replacement cost, divided by the number of validated successful cycles. Buyers should use their own operating data rather than assuming a fixed number of reuse cycles.
Safety Factor and Construction
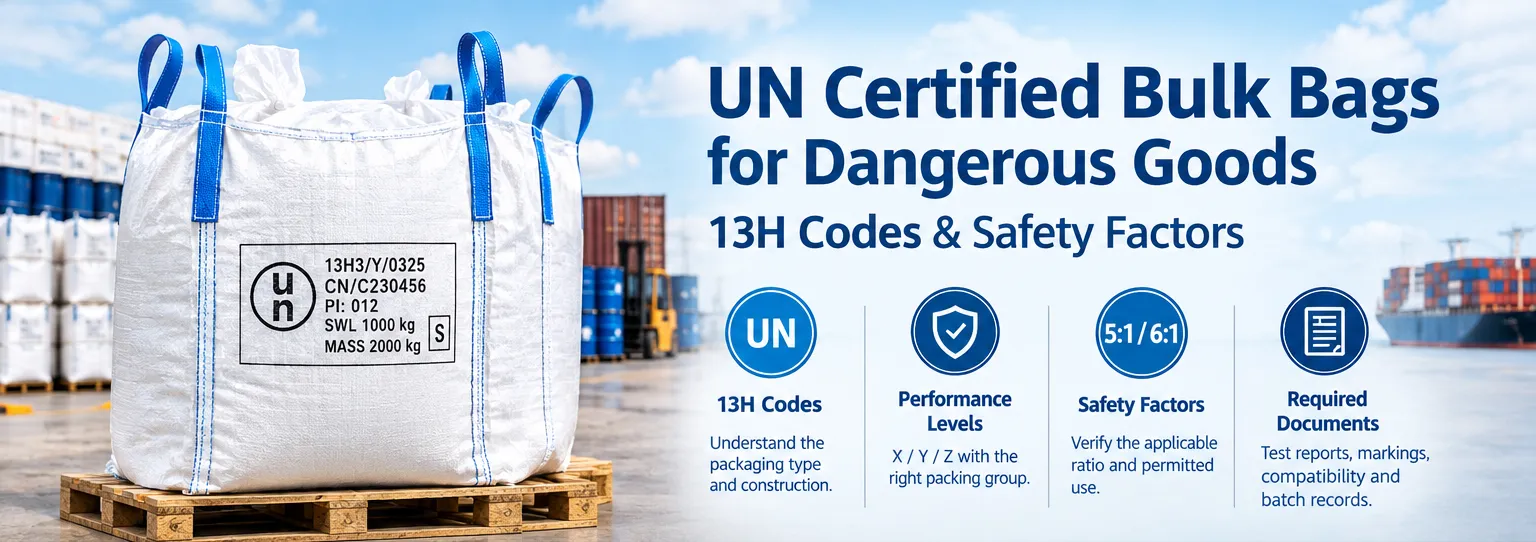
Multi-trip bags are built for repeated use, and the safety factor should be specified for the SKU and application rather than assumed from the trip count. A specified safety factor should be verified for the individual SKU and application through the applicable ISO 21898 test method, with documented SKU-level acceptance criteria and test records. Reinforced lifts, denser weave and robust seams let the bag survive repeated handling, filling and emptying when validated for the duty.
Buyers should confirm the declared safety factor and request test documentation, since a bag mislabelled for multi-trip use is a safety and compliance risk.
PP tape quality and circular-loom weave density set fabric consistency, while seam design and lift-loop configuration determine how load is distributed through the bag; these should be validated for the SKU’s load, handling and reuse conditions.
Applications Driving Demand
- Chemicals. Powders, granules and flakes moving in closed loops between sites and customers; Packaging Market Insights places chemicals at 39% of multi-trip use by its application-share metric, whose exact denominator (units, revenue or shipments) is set by the source report and should be confirmed before use.
- Agriculture. Seed, grain and animal-feed cycles where clean returns are feasible; the same source places agriculture at 31% by the same application-share metric.
- Food and minerals. Where contamination control and repeated handling favour a robust, inspectable container.
Challenges Buyers Should Plan For
The same report set flags real constraints:
- Resin cost exposure. PP resin is a major cost component of FIBC manufacturing, and its price can swing materially year to year — relevant because multi-trip bags use more material per unit. (Per Packaging Market Insights, resin represents a substantial share of FIBC conversion cost and resin-price volatility can materially affect pricing; the report’s exact percentages depend on its defined period and PP-resin benchmark.)
- Margin pressure. Resin volatility can put pressure on manufacturer margins and affect lead times and pricing (the same report cites ~34% of manufacturers reporting margin pressure).
- Logistics discipline. The reuse model depends on a workable return, inspection and cleaning system; buyers should evaluate these operating costs together with purchase price and validated service life.
Choosing a Multi-Trip FIBC Supplier
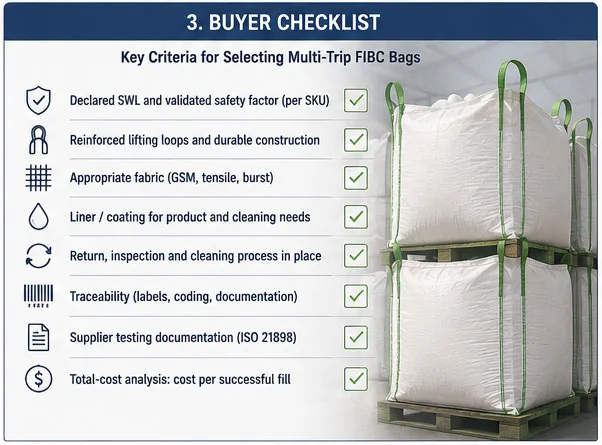
For a multi-trip FIBC bag program, buyers should evaluate three areas: bag performance, reuse-system requirements and commercial fit. Confirm the applicable FIBC construction and electrostatic classification (Type A–D, where relevant), the FIBC class, declared SWL, safety factor and supporting test documentation for the exact SKU. Then evaluate MOQ, production capacity, lead time, import classification and logistics costs against the planned reuse cycle.
- Documented safety-factor testing against the applicable ISO 21898 requirements, with SKU-level acceptance criteria and test records for the declared SWL.
- Lift-loop and seam construction supported by documented repeated-use testing and SKU-level acceptance criteria.
- Traceability (batch codes) to support inspection and recall control.
- OEM and custom options for liners, coatings and printed identification.
- Clear guidance on cleaning and re-inspection intervals.
Key Takeaways
- According to Packaging Market Insights, the multi-trip FIBC bags segment is projected to grow faster than the overall FIBC market, though buyers should validate the source’s market definitions before planning.
- The right comparison is cost per successful fill, not price per bag — multi-trip can win when its validated service life and return/inspection/cleaning costs support the reuse model.
- Safety factor should be specified and verified for the SKU and application; where ISO 21898:2024 applies, buyers should confirm the applicable FIBC class, marked SWL, required safety factor, test method and documented acceptance results rather than inferring reuse suitability from the trip count or safety-factor number alone.
- Success requires a managed return-inspect-clean loop and awareness of resin-cost exposure.
For industrial buyers, multi-trip FIBC bags are less a packaging choice than a logistics-system decision. Specify the safety factor, build the return loop, and the per-fill economics and documented reuse metrics follow. For a managed reuse program, contact the FIBC team to discuss documented testing, custom construction, printing and traceability requirements.
Frequently Asked Questions
According to Packaging Market Insights, it is projected at US$4.26 billion in 2026, growing to US$8.41 billion by 2034 at an 8.86% CAGR — faster than the overall FIBC market growth rate.
The cited market outlook points to growing interest in reusable bulk packaging, while the commercial case is driven by total cost of ownership, validated reuse and documented waste-reduction or circularity metrics. The model is most attractive where industrial buyers can operate a reliable return, inspection and cleaning loop.
The required safety factor depends on the FIBC design, applicable class, handling conditions and test requirements. Where ISO 21898:2024 applies, buyers should confirm the applicable class, marked SWL, required safety factor, test method and documented acceptance results for the exact SKU rather than assuming that a particular safety-factor number alone makes a bag suitable for repeated use.
Per bag it costs more, but it can have a lower cost per successful fill when its validated service life and return/inspection/cleaning costs support the reuse model.
Chemicals lead (Packaging Market Insights: 39% of multi-trip use by its application-share metric) and agriculture follows at 31%, with food and minerals also significant where clean returns are feasible.
PP resin is a major cost component (Packaging Market Insights notes resin represents a substantial share of FIBC conversion cost with material price volatility), ~34% of makers report margin pressure, and multi-trip only pays with a disciplined return-inspect-clean system.
Request the declared safety factor, the applicable ISO 21898 test method, the test report and SKU-level acceptance criteria, and confirm lift-loop/seam construction supported by documented repeated-use testing.
Yes — liners, coatings, printed identification and batch traceability can be specified through OEM/custom programs to support inspection and loop management.